


MarketWatch Redesign Overview
MarketWatch by Highland Ag Solutions harnesses the power of data analytics to empower businesses in the fresh produce industry to make informed, data-driven decisions. It optimizes operations and enables companies to seize opportunities in a rapidly evolving market. By revolutionizing how agricultural businesses approach market analysis, MarketWatch helps them maintain a competitive edge in a dynamic industry.
The Challenge
Users of traditional market-watch / tracking apps often face several pain points:
- Fresh produce industry users often work in dynamic environments: shipments, changing inventory, seasonal fluctuations, logistic constraints. Having to launch a heavy desktop dashboard might not be ideal.
- The SaaS platform includes a large amount of data and on mobile, displaying this intuitively without overwhelming the user is difficult.
- Data input from ERPs may have lag or be complex; users need trust in the data and accuracy.
- Users may neglect mobile access if it’s a scaled-down version of the desktop rather than optimized for mobile tasks.
Research & Insights
Competitive Landscape Analysis
- Reviewed other SaaS dashboards in agriculture/fresh produce/logistics verticals, mobile versions of enterprise analytics tools, and general market-data apps (e.g., financial apps).
- Identified common pain points: too much data on one screen, heavy menus, charts not optimized for mobile, poor offline/low-connectivity support.
User Interviews
- Spoke with stakeholders (growers, packer/shippers, logistics managers) about how they use market data: “When I’m at the terminal, I just need to know: what’s the freight rate doing this week compared to last?”
- Questions included: What data do you absolutely need on mobile? How often do you check it? Under what environment (warehouse, truck, terminal)? What frustrates you about mobile dashboards?
- Insights: Users want glanceability (“What’s changed since yesterday?”), actionability (“Should I shift routes or change pricing?”), and trust (“Is this data fresh/accurate?”).
Persona and Use Cases
- Logistics Manager: On the road, wants to monitor freight rate trends, get alerted if rates surge and respond quickly.
- Sales/Trader: In field, tracking inventory levels and pricing benchmarks, comparing their company vs the market.
- Operations Director: Wants overview of key KPIs weekly/monthly, but also needs mobile check-in when traveling.
Key Findings
- Users cared about delta: what changed vs prior day/week, more than raw numbers alone.
- Notifications about key changes (e.g., freight rate +10%) were considered highly valuable; but users were wary of “noise” (too many alerts).
- Visualisation of benchmark vs self-company was powerful: users liked seeing “we are above/below benchmark” in simple terms.
- Clarity on data freshness and source mattered: mobile users asked “when was this last updated?” to trust the data.
Goals & Success Metrics
Design Goals:
- Glanceable Home Screen — enable user to open app and within ~10 seconds view key metrics (company vs benchmark) and any alerts.
- Mobile-Optimized Navigation — simplify navigation to few key functions: Dashboard, Alerts, Benchmark Trends, My Company Data.
- Actionable Alerts & Notifications — make it easy for user to set mobile alerts for key metric changes (freight, inventory, pricing) and respond via mobile.
- Trust & Clarity — transparency of data source and freshness, benchmark context, secure login UX.
Success Metrics:
- Time to key metric on home screen under 10 seconds.
- % of users who set at least one mobile alert within first 7 days.
- Daily/weekly active mobile users increases by X%.
- User satisfaction (via in-app survey) target > 80% for mobile usability.
- Retention: fewer users dropping off mobile usage after initial login.
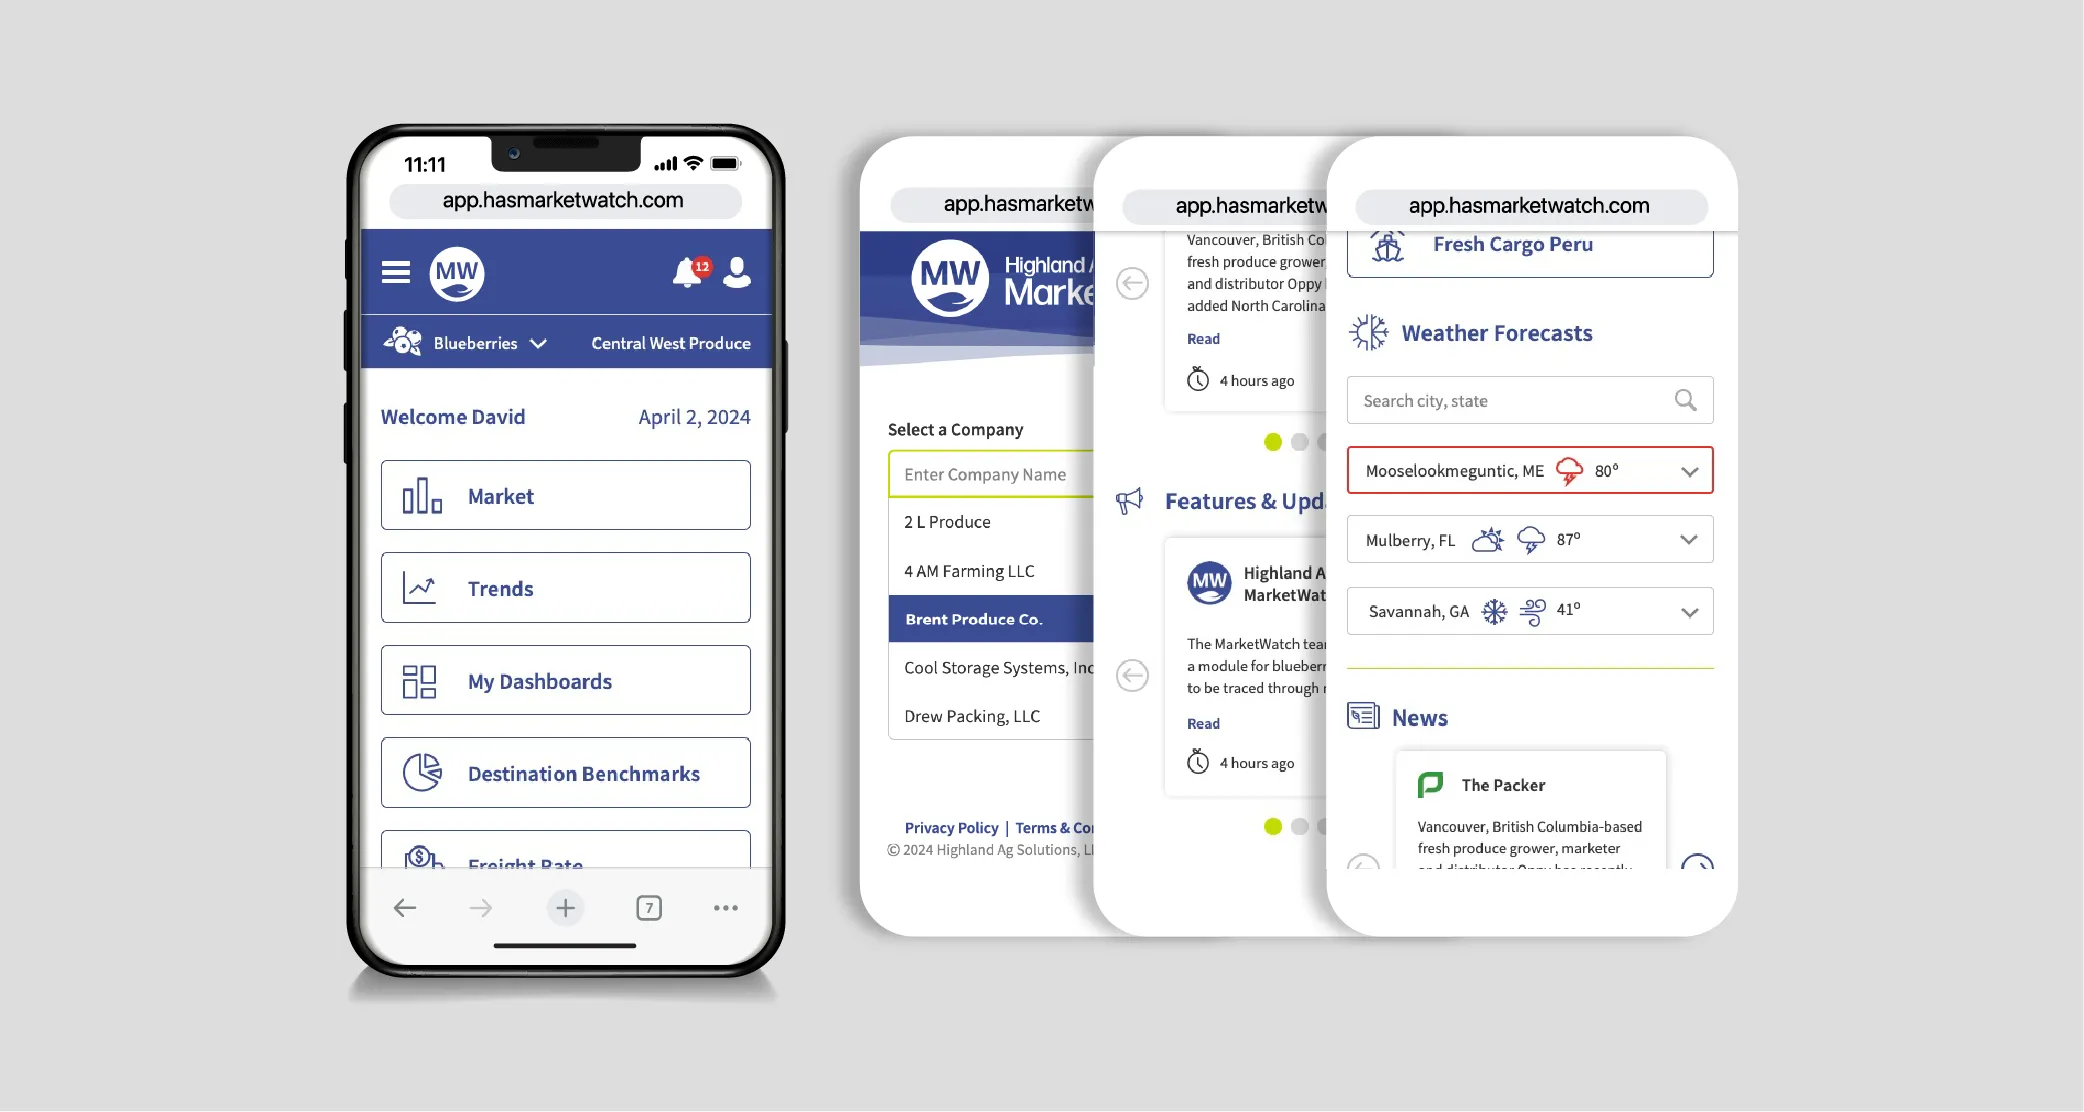
Information Architecture & Core Flow
Home / Dashboard
- Top: Company’s key metrics (pricing, inventory, freight) vs benchmark
- Middle: Alerts summary (recent triggered, upcoming)
- Bottom: Quick links: My Trends | Set Alert | Compare Benchmark
Trends / Benchmark View
- Filter by data type (pricing, inventory, freight), time-range (day/week/month)
- Company vs benchmark chart
Alerts
- List of configured alerts
- Create new alert (choose metric, threshold, timeframe)
- Triggered alerts history
My Company Data / Profile
- View own company’s metrics, details, settings
- Access security/login, offline mode settings
Settings
- Notification preferences
- Data refresh frequency
- Offline cache toggle
- Help / Glossary (what the metrics mean)
A New Login with 2FA
Given the sensitivity of the data shared with users, it was essential for the new release to incorporate multiple safety measures, including two-factor authentication and hundreds of data integrity flags to prevent errors from affecting the aggregated market visualizations..
The architecture is built around four key principles: Privacy, Anonymity, Security, and Transparency.
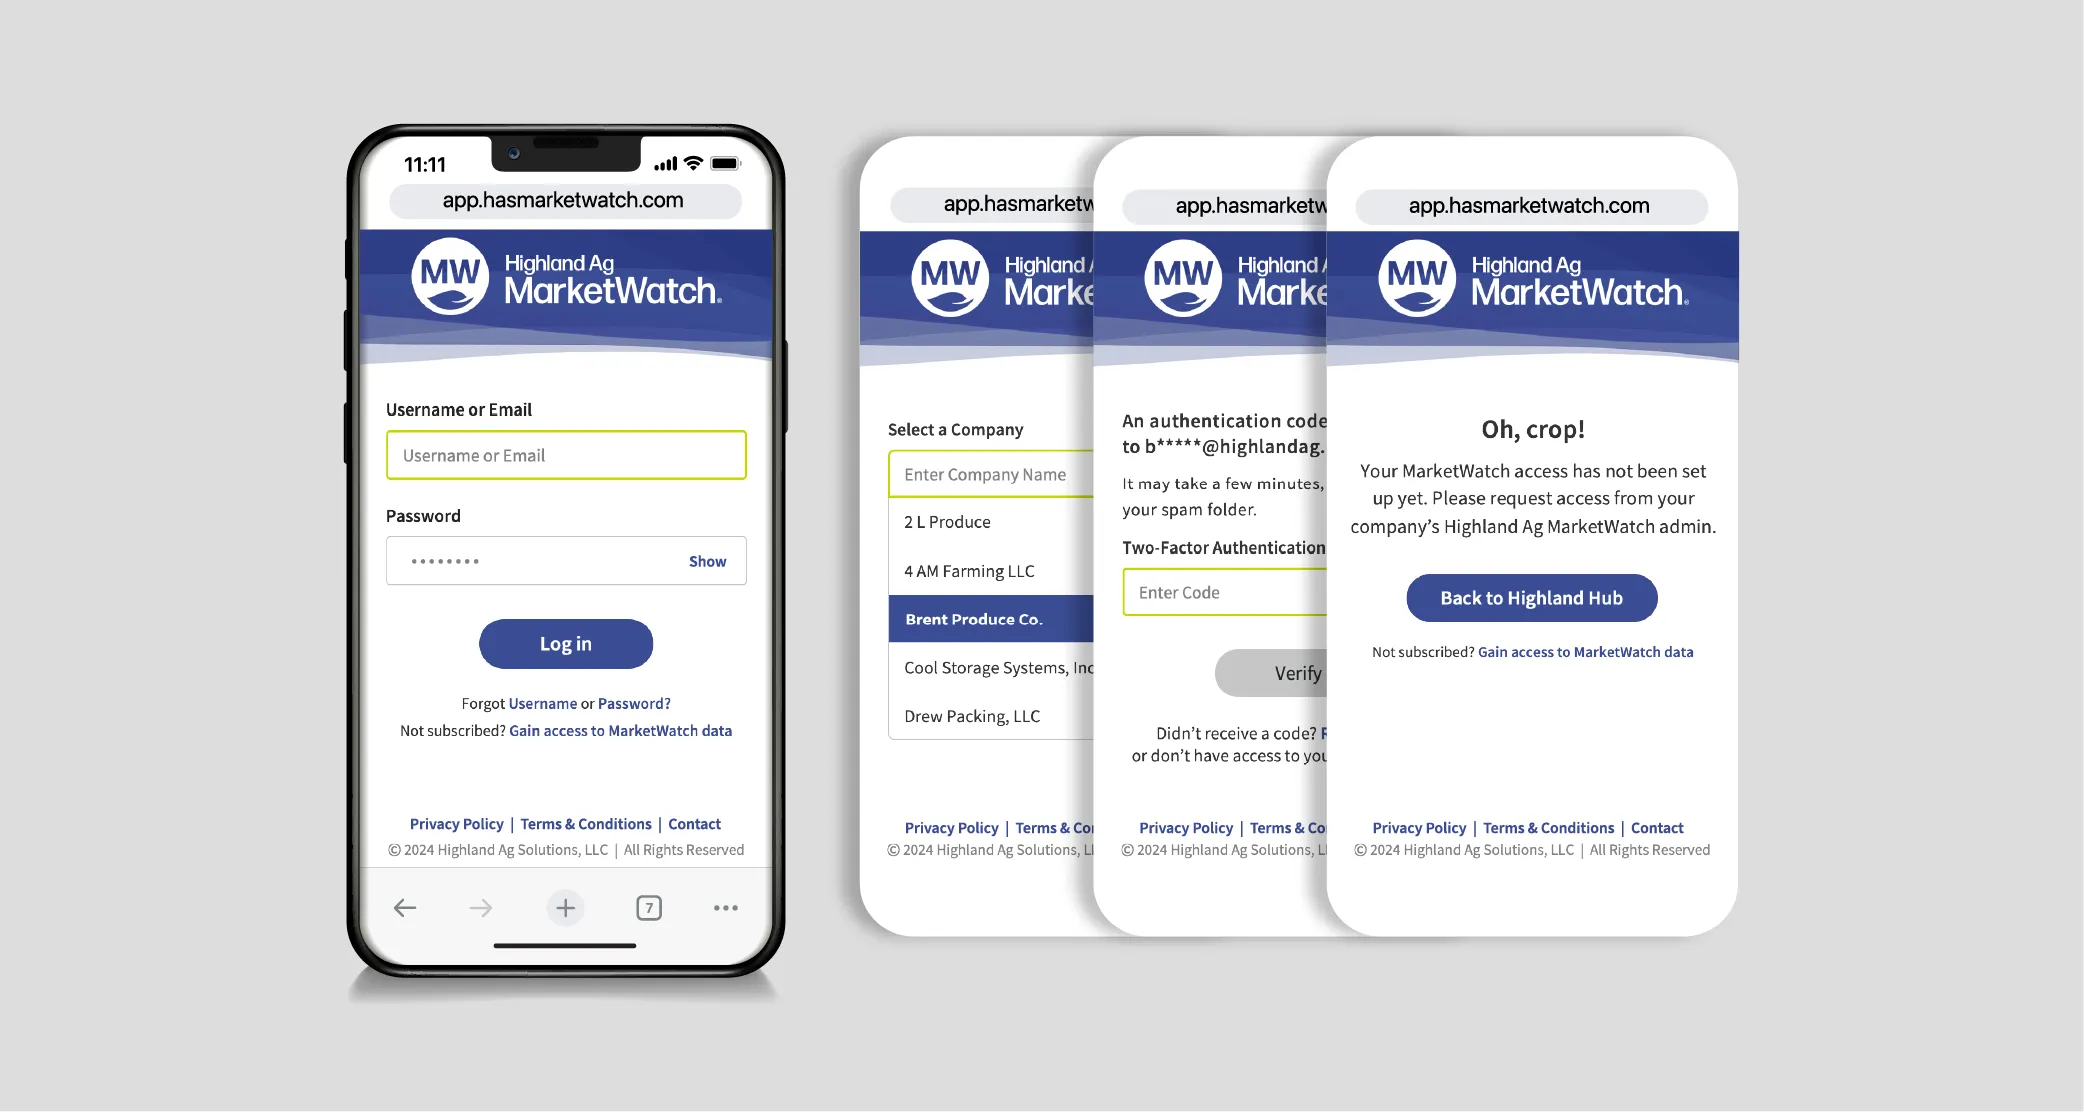
A sample from the 62 pages of wireframes to account for every action of the login process alone.
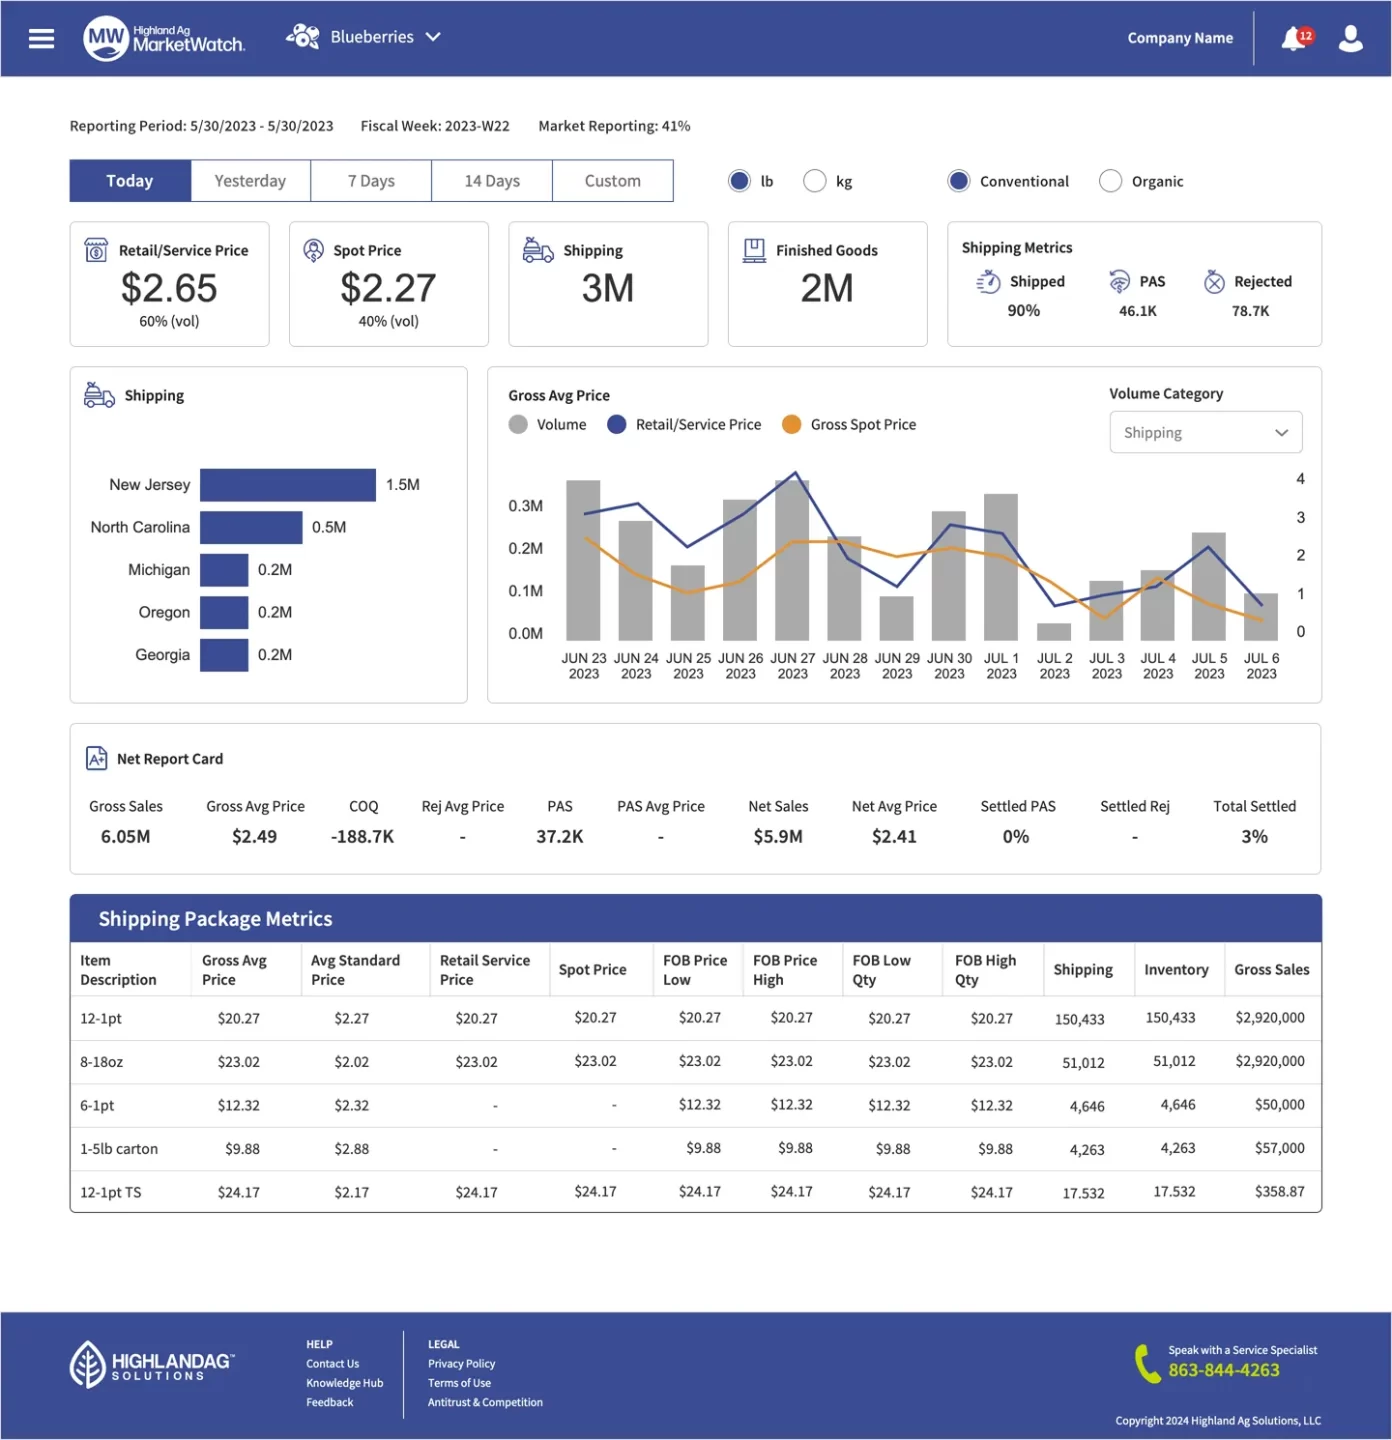
Dashboard Upgrades
The dashboard shown below is the result of extensive user research, including interviews with various user types across supporting organizations. We employed card sorting, user-role personas, and unmoderated prototypes to establish the data hierarchy and optimize task flows.
Learnings
- Users opened the mobile app more frequently (daily vs weekly).
- The number of mobile alerts increased (indicating adoption of mobile workflows).
- Some users shifted decisions (e.g., freight routing, inventory management) based on mobile insights they received via alerts.
- In industry-specific SaaS (fresh produce, logistics), mobile must prioritize key tasks and glanceability, not full feature mirroring with desktop.
- Benchmarking vs self-metrics is powerful: users appreciated seeing “where do we stand vs the market?” rather than only their own numbers.
- Connectivity context matters: mobile users in field environments need caching, quick loads, offline fallback.
- Designing for thumb-reach, simplified taps (instead of complex gestures) improved usability especially for “on-the-go” users.
Hard Work Rewarded
AgTech Breakthrough, a leading market intelligence organization that highlights the top companies, technologies, and products in the global agricultural and food technology sectors, recognized Highland Ag in its annual AgTech Breakthrough Awards program.
Our goal was to transform the global fresh produce industry by providing valuable insights that enable businesses to make smarter decisions. By leveraging the platform’s unique capabilities, companies can enhance their competitive advantage, make data-driven choices, and accelerate growth in a fast-paced and ever-changing market.
Retrospective
The new launch version of MarketWatch by Highland Ag Solutions demonstrates a robust UX approach in a complex data-analytics space. By reframing the platform to equally address mobile users — focusing on glanceability, benchmark comparisons, and actionable alerts — the design elevates the product’s relevance for industry professionals in fresh produce logistics. The case also exemplifies how SaaS can achieve mobile usability without sacrificing data richness.